THURSDAY, 19 MARCH 2020
Over 2600 years ago, the Babylonians crafted the Imago Mundi, a clay tablet depicting the first map of the world. Flash forward to the modern day, and humanity’s fascination with cartography — be it sea-weathered scrolls leading to unforetold treasures or Google Maps simply pointing us in the direction of our next coffee — has shown little signs of waning. Be it motivated by war and the struggle for power, by the search for wealth and resources or by the human passion for exploration, charting our place in the universe has been a mainstay of cultures the world over. Progress in science and technology has not only seen the accuracy of charts improve, but also fuelled a huge growth in their scope. Geologists can now map rock units to look at the world beneath our feet while astrophysicists fervently look outwards to develop increasingly detailed atlases of the cosmos. Elsewhere, scientists have begun exploring the structures of the deep ocean, a domain that, though part of the Earth, so often seems to be to belong to a whole other planet.Charting the Heavens
The Earth’s surface was not the first area to be mapped. This honour is rather afforded to the heavens. Cave paintings of constellations and other celestial objects were first produced over 17,000 years ago in Eastern Europe. Indeed, humans had been speculatively creating images and models of the cosmos long before Galileo's development of the telescope unlocked the heavens to human exploration. However, it was only in the 16th century that the charting of the skies flourished into a useful tool that shed real light on the universe and its formation. At that time, Flemish polymath Gerardus Mercator crafted the map of the world most familiar to us today. He followed the formulation of his mathematical projection of the globe by attempting to produce a map of the cosmos, and coined the term ‘atlas’ in the process.
Not unlike those 16th century pioneers and many before them, astrophysicists today seek to understand the creation of the universe via the mapping of the cosmos. Charts illustrating the distribution of dark matter, the cosmic microwave background and even simply the shapes of galaxies and nebulae help to rationalise otherwise overwhelming problems and gradually lift the curtain on underlying physical processes. Just this year, researchers at the University of Warsaw were able to make use of the light from distant but incredibly bright pulsating stars called cepheids to develop a model of the galaxy. This model surprisingly suggests that the Milky Way is in fact not the flat disc shape it was believed to be, but rather a disc warped into an S shape. Such warping suggests the Milky Way may have interacted with other smaller galaxies or perhaps with dark matter in the past.
Looking Inside the Earth
Science has not only allowed mankind to look outwards; with the use of new technology, geologists are becoming increasingly able to chart the structures and patterns beneath our feet. To learn more about how mapping has aided our geological understanding, I spoke to Dr Owen Weller, a lecturer in the Department of Earth Sciences at the University of Cambridge who has been involved in mapping projects with the Geological Survey of Canada. Weller explains that maps are crucial for yielding context from observations, allowing patterns to be identified and links to be made across both time and space. For example, his recent work mapping Baffin Island can be linked to phenomena as tangible as present-day processes in the Himalayas or past processes as ancient and elusive as the origins of plate tectonics.
When asked about what has changed since the first geological map of Britain, made just over 200 years ago, Weller praises GPS technologies and computer software for improving mapping accuracy. Both advancements allow for increasing location precision and the compilation of larger datasets. To fully understand and interpret the deeper structures from a surface map, a sequence of ages must be known. Weller explained: “To make maps most useful, geochronology is required. A seminal moment in mapping was the development of radiometric dating to place absolute age constraints on rock assemblages”. Though it does not particularly aid the creation of maps, absolute dating hugely enhances geologists’ interpretation of them. Dating reveals to geologists the order in which rocks were formed - essential information if one is to truly understand the geological events of the past. Looking to the future, Owen suggested that space-based geophysics and remote-sensing will be key tools in the mapper’s arsenal as both allow for huge areas to be mapped quickly and efficiently through satellite observation. Despite all these changes, Weller keenly points out that ultimately, field geologists cannot be replaced, as direct observations will always be fundamental to mapping. Geological mapping can’t get far without a hand lens and a hammer.
Besides being a tool for geographical exploration, geological mapping is also, perhaps more importantly, a valuable tool for assessing hazards and resources. Orientations of fault lines and the structures in bedrock can, via the use of a map, be analysed over a huge area to locate likely sources of mineral ores or to assess the likelihood of a seismic event in an area. Although often popularly perceived to have had its heyday, geological mapping is in fact still a hugely relevant discipline as the Earth becomes increasingly depleted of energy resources and as construction projects are undertaken in new and bold locations.
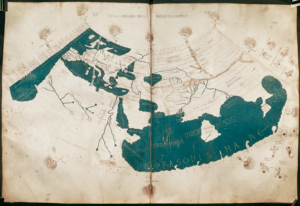
A medieval recreation of the first semi-accurate World map. Ptolemy produced a map of the World from the perspective of Hellenistic society in about 150 AD, in his work Geographia.
Exploring the Oceans
In the past century, geoscientists have begun to build up a picture of not only the rocks on the continents, but also those beneath the ocean. Such is the elusiveness of the seafloor, that in many locations we have a better understanding of the topography of Mars. The first bathymetric mapping endeavour was undertaken in the early 20th century using ‘echo sounding’, a technique which uses the reflection times of transmitted sound pulses, and the speed of sound in water (~1500m/s) to calculate depth. Paralleling geological mapping, advancements in GPS and the onset of data-compiling software has allowed a great increase in accuracy since these early experiments, allowing for highly detailed models of the seafloor surface to be produced.
One such modern and highly accurate method to be employed is Airborne Laser Bathymetry (ALB). ALB uses short pulses of light to measure distances. Such a method can be carried out from an aircraft, allowing for research to be conducted at a much greater pace than sound wave-based mapping which takes place from sea vessels. The detailed models produced give an insight into ocean processes for physicists, geologists, chemists and biologists alike. For example, bathymetric data along the mid-Atlantic ridge is used by geologists to track the movements of the continents and was key evidence in support of the theory of continental drift. This type of inference from ocean depth to plate tectonics is a wonderful example of how mapping helps reveal patterns and improve human understanding of otherwise impenetrable systems. Ocean depth is also intimately linked with the local ecosystem, since temperature, light level and nutrient concentration dictate an environment’s habitability. Biological oceanographers therefore use bathymetric surveys to predict where fish and other organisms will live, breed and migrate. Studying bathymetric data is vital in the midst of the climate crisis, helping scientists better understand how many facets of the Earth system are changing, including rates of beach erosion, land subsidence and sea-level rise.
Our fascination with maps spans both the distant past and the foreseeable future. Long before the development of formal written language or numerical systems, we crudely began charting the universe, smearing fantastical patterns onto cave walls and etching them into stone. Today, technological advancements have transformed cartography into a fundamental tool for making sense of the physical world at various scales, from the depths of the oceans to the heights of the heavens. Beyond this, science and technology have totally transformed the scope and detail of cartography, offering these fields a perfect synergy. We have created ultra-precise maps of Antarctic ice sheet topography and developed cosmic "hotspot" guides pinpointing the remnants of exploded stars. The question is: Where will exploration take us next?
James Craig is a second year Natural Scientist at St. Catherine's College.